


Investar Mobile for NSE BSE
 
.bullet
{
パディング:0px 0px 0px 20px; line-height:normal; margin-top:5px; margin-right:0pt; margin-bottom:0pt; margin-left:10px;背景画像:url(images / icon1.jpg);背景位置:左3ピクセル;バックグラウンドリピート:no-repeat;
}
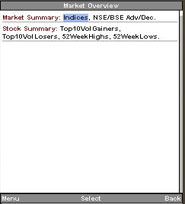
Shows Interactive Candlestick & Line chart (six month daily view) along with Indicators like EMA, SMA, RSI, Stochastics, MACD and Volume.
Splits, Dividends and Bonuses displayed in the Charts.
Shows OHLC values
Shows Pivot Lines and Resistance & Support Levels.
Allows users to Add Notes.
同様のアプリ
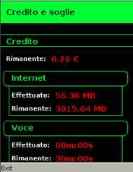
See Credit and thresholds of TRE
31 May 11
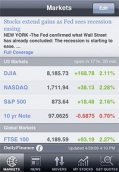
DailyFinance
17 Jan 11

Accounting Terms Lite
9 Aug 12
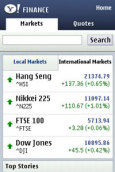
Yahoo! Finance
1 Mar 11
へのコメント Investar Mobile for NSE BSE
デバイスで検索

人気のアプリ

Kaspersky Security 4 Apr 12

Snake III 2 Feb 17

Jimm MIDP2 26 Dec 10

Mobile Drag Racing 1 Feb 17
Angry Birds News on biNu 20 May 11
QQ Browser Mini for Java 5 Jun 12

Facebook for Java 8 Feb 17
コメントが見つかりません